Editorials and Articles Archive
Free Fallin'
How might American Idol improve the "ratings" that truly matter?
10 March 2013
OK, let's face facts. Season Twelve's ratings are down. Way, way down. So far down you'd need two spelunkers and an oil drill to retrieve them. They've never been this far down at this stage of the competition, and for once we'd have to agree that the cold panic gripping the Idolsphere this March is entirely justified. The apocalypse, it seems, is nigh at hand....
Are we talking about WNTS.com approval ratings? Heck, no. Sure, they're down too, but that's because the producers introduced the new Quarterfinals format in 2013. In previous years we'd have anywhere from 24 to 36 rated contestants; in Season 12, we had 40. The field was diluted, and that's why the pre-finals rating staggered home at about 47...which, to be honest, is actually right around the historical norm. The "cast rating" of the AI12 finalists (their average rating coming out of the pre-finals) is 63.5, and only AI2 and AI10 are materially above that.
As we wrote in last week's editorial, the quarterfinals were unquestionably a bit of a slog to sit through, but on balance we'd say it was worth it. By having two performances rather than one on which to judge each semifinalist, America did a solid job choosing the Final 10. (For what it's worth, we'd have replaced one of the girls with a different semifinalist, and three of the guys with one semifinalist and two quarterfinalists, primarily for musical diversity. But, that's just us.) Moreover, we expect to see some of the eliminated quarterfinalists come back in future seasons, and when they do, they'll have one frightening, knee-buckling, nationally-televised performance under their belts, which can only help.
No, the ratings we're referring to are the ones that you immediately think of when discussing any television show except American Idol. Nielsen ratings are in the tank. The Girls' Semifinal episode drew 11.7 million U.S. viewers, the fewest of any competition night since the AI1 Final 8. By way of comparison, the highest rated episode in Idol history was the AI6 season premiere in January of 2007, which pulled in 37.4 million pairs of eyeballs. Over the past six years, in other words, the show has misplaced about 70% of its audience. We presume this is not good.
So for this weekend's editorial, let's spend some time analyzing those other ratings – the ones that are far less interesting to us but, we'd venture to guess, a little bit more near and dear to the hearts of Simon Fuller and the folks at Fox. Keep in mind that we're music fans and math geeks, but not television industry experts in the slightest. So we cheerfully admit that we really don't have the foggiest clue what we're talking about, okay? Not that that ever stopped us before.
She's a good girl/Loves her mama...
One fact needs to be placed front and center: all network TV ratings have been on the downslide for years, and they've fallen off a cliff the past few seasons. Analysts blame weak lineups, the weak economy, the rise of cable dramas, widespread use of DVRs and VOD, increased volcanic activity on Jupiter's moon Europa, and a bunch of other factors. To illustrate how little we know of all this: we had to google what VOD stood for. (If you happen to be as clueless as us, it's Video On Demand. Shrug.) American TV these days is basically Sunday Night Football, NCIS, and a race to the bottom among everything else.
Still, you don't need to be as astute as Al Michaels or Abby Sciuto (yeah, we had to google her last name, too) to know that American Idol is falling faster than the other leading series. While networks seem to be losing about 5% of their viewers every year, give or take, AI is losing 15%. Clearly something is going on beyond just regular TV watchers finding other ways to spend their evenings.
Now, American Idol is a reality TV competition (RTVC), and most reality TV competitions' seasons follow the same basic story arc: a few expository episodes to introduce the cast, followed by a more or less single-elimination format until a winner is crowned. The challenge for these series is twofold. First, bring in as many viewers as possible in the early going to get them interested, and second, keep them engaged enough to follow the competition through until the end.
With that in mind, let's take a look at a couple of scatterplots we made. Our data comes from the Nielsen Company by way of Wikipedia.
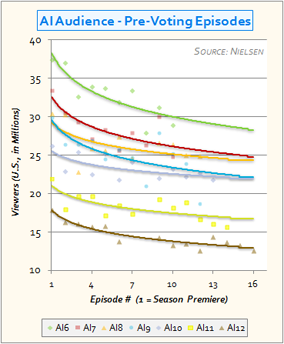
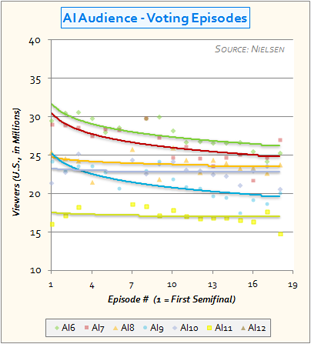
Starting in Season Six, when Idol's ratings peaked, we took the overall viewership of every AI episode except results shows and a handful of one-off, non-competition specials. Then, we broke them down into "Pre-Voting" and "Post-Voting" categories. The former comprised audition, Hollywood, and Vegas episodes (including this year's quarterfinals.) The latter are the performance shows from the semifinals and finals – essentially, the entries in our Episodes database (including wild card shows in which we viewers weren't given the opportunity to vote.)
So that we could generate apples-to-apples trendlines, we ensured that the first Hollywood and first Finals episode in each year had the same ordinal number. For example, if there were four audition shows in one season and seven in another, then in both years we listed the first show of Hollywood week as #8.
Finally, we plopped everything into an Excel spreadsheet and had it generate regression trend lines for us. And, drum roll please, the results are as follows:


If you're having trouble reading the keys, the color assignments are: AI6=green, AI7=red, AI8=orange, AI9=blue, AI10=purple, AI11=yellow, and AI12=brown. Note that to save a little bit of real estate, the X-axis in both charts starts at 10 million viewers rather than zero. Thus, the relative dropoff between the AI6 (green) and AI12 (brown) trend lines isn't quite as bad as it looks. But, it's still really, really bad.
Begin by turning your attention to the left chart's Y-axis. This shows roughly the Idol viewership in each year's first audition episode. With the sole exception of Season Nine, every season has seen a pretty substantial year-over-year dropoff in premiere viewers. This tells us something right from the get-go: Fox hasn't exactly been doing a bang-up job of bringing customers in the door early.
Now take a look at the relative slope of the trend lines in both graphs. Invariably, they head downwards. We checked out a few similar series' ratings as well, including The Voice, Hell's Kitchen and Survivor, and this appears to be the norm. For an RTVC series, maintaining one's audience is its most serious challenge, some years more than others. The generally poorly-received AI6, for example, tracked to shed nearly 10 million viewers before America was even given the opportunity to vote.
But, note this curious fact as well: The trend lines in the left chart all have a greater slope than the corresponding colored lines in the right chart. For American Idol at least, this means that pre-voting episodes lose viewers at a much faster pace than the voting ones! In fact, in three of those years, Idol hardly lost any viewers at all once the semifinals got underway: Seasons Eight, Ten and Eleven. In the other three, there was a notable decrease in the early going before things stabilized. (It's probably not a coincidence that those were the years the three-round semifinal format was used, nor that AI6 and AI9 had very low WNTS approval ratings. AI7 would seem to be an outlier for reasons unclear.)
Note too that most seasons enjoyed a little bit of a bump between the end of the pre-voting phase and the start of the voting phase, some more than others.
I'm a bad boy/'Cause I don't even miss her...
We've often wondered why American Idol spends so much time early in every season on auditions and Hollywood. Honestly, we consider the audition episodes to be the dullest of the calendar, though we usually watch them because duty compels. Hollywood is only a slight improvement. We assumed the reason was because Idol, unlike other RTVC shows, focuses most heavily on the contestants' personal journeys, from the first mass cattle call to their eventual elimination...or, in one person's case, their confetti shower. Save perhaps for the years that Simon Cowell was an executive producer, we'll agree that the show has always been more about the contestants than the judges.
Now, however, we're not so sure. Could it be that Fox and 19E cling to the painfully drawn-out audition process because those episodes' TV ratings are nominally higher? In other words, are they looking only at the raw viewership numbers and concluding that America likes auditions more than competition? Again, we're not TV experts, but it would seem to us that this would be a rather big mistake. All RTVC series lose viewers as their seasons progress – it's the nature of the format that once a viewer loses interest in the current story arc, he or she won't be back until next season, if at all.
We'd think that these series ought to be maximizing the percentage of episodes in which its audience erosion is at a minimum. For American Idol, that means voting nights. An engaged audience may or may not be a happier one (we've all sat through enough godawful semifinal shows to realize that), but it's a more loyal one. The very tricky challenge for the producers is in striking the right balance between exposition, where interest is built and core fan bases are forged, and competition. We have no bright ideas to offer, and even if we did, we'd keep our mouths shut and leave this matter to the pros. But, surely there has to be a better way than spending the first 12 to 16 episodes each year having we fans sit on our butts and do nothing except watch auditions and catfights.
![]()
![]()
![]()
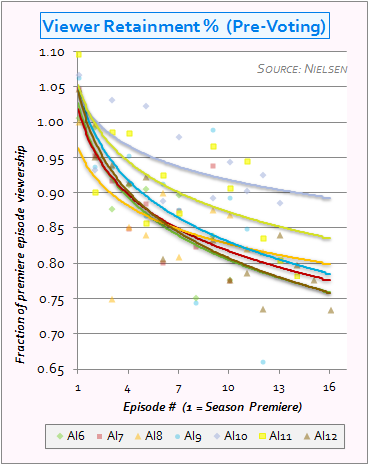
One last graph before we go. As we stated, every season of American Idol loses a significant number of viewers as it goes along, particularly in the pre-voting stage. Raw viewership totals, however, probably aren't as important as what we'd term viewer retainment percentage. We wondered which seasons managed to hold on to the highest ratio of its opening-week episodes.
The chart below provides us a clue. All we did was divide each night's viewership total by the average of its first two episodes. The steeper the slope, the greater percentage of viewers decided that they could do without waiting until the voting got started, thank you very much.

If you're wondering why there are only six trend lines rather than seven, the answer is: there are seven. Two of the lines just happen to be so insanely close to one another than they basically overlap the whole way down. That would be the bottommost line in the graph, and the two seasons that have seen its Neilsen ratings drop the fastest from its premiere are Season Six and...(*gulp*)...Season Twelve. Both wound up losing almost 25% of the people who initially tuned in. For AI6, we'd guess that too much crappy singing was the cause. But whither AI12?
Quite a few things changed in the past nine months. Idol now features three new judges, a new three-stage competition format, more ethnic diversity but far less musical diversity among the contestants (in particular, a rather transparent attempt not to have another WGWG winner), and uptempo songs are apparently punsihable by death. Which of these have "worked" and which haven't, to the tune of one in four viewers checking out in under seven weeks? We don't know for certain but we have a few sad suspicions (see last weekend's editorial for details.) We'd like to see the quarterfinals format retained for at least one more year to see how it develops, but beyond that, we leave it to the producers and the Idolsphere to figure out a way to stop the free fall. Maybe a Tom Petty Night would help?
- The WNTS.com Team

