Editorials and Articles Archive
Location, Location, Location
How performance order does (and does not) make a difference on American Idol
20 April 2008
After the surprising elimination of Michael Johns in the Final 8 Episode, many of his heartbroken fans blamed the fact that he happened to be the first singer of the night. If only Johns hadn't been forced to sing in the cursed "Death Spot", they wrote plaintively! If only he'd sung second or third, when more viewers were watching and where voters were less likely to overlook him! If only he hadn't tried that ill-advised falsetto scream at the end! (Well, we wrote that, anyway.)
Is there really a jinx associated with singing first on American Idol? Or is it only an urban legend on a par with Nigerian email scams and Neiman-Marcus cookie recipes? The folks at USA Today decided to nail this down once and for all. They turned to WhatNotToSing.com for the facts and statistical analysis, and the results of our joint effort were published in their Life section on Monday, April 21st, 2008.
USA Today didn't have room to print all the data we sent them. Heck, neither do we. But here's a more detailed sampling of what our crack detectives uncovered when "The Nation's Newspaper" put us on the case.
The Ground Rules
To simplify matters, USA Today and WNTS.com agreed to limit the analysis to Finals episodes only – that is, beginning with the Final 10 in Season One, and the Final 12 onwards since. We'll discuss the Semifinals briefly later, but we'll tell you up front: there's no significant difference in the results.
| Slot | Performances |
|---|---|
| 1st | 69 |
| 2nd | 69 |
| 3rd | 63 |
| 4th | 57 |
| 5th | 51 |
| 6th | 46 |
| 7th | 39 |
| 8th | 32 |
| 9th | 24 |
| 10th | 19 |
| 11th | 12 |
| 12th | 6 |
Through the AI7 Top 7 (Mariah Carey Night), there have been a total of 69 shows in the Finals. In 65 of these, exactly one contestant was dismissed from the competition. The other four episodes had unusual elimination patterns. Nobody was eliminated during AI6's Idol Gives Back week, but two were sent home the following week. Nobody was eliminated in AI2's Top 9 Night, either, owing to Corey Clark's disqualification (which we've ignored for this analysis.) Finally, two contestants rather than one were sent home from the AI1 Top 10, for no particular reason. Add, subtract, and carry the one, and you'll see that there have been 69 eliminations exactly as you'd expect, though how we got there was a bit unexpected.
On weeks in which contestants performed more than once, elimination data is based on his or her first performance slot. Take the Season One Finale, for example, where Justin Guarini and Kelly Clarkson sang three songs apiece. Guarini sang 1st, 3rd, and 5th, meaning that Clarkson (duh) was 2nd, 4th, and 6th. To keep the data meaningful, Guarini's elimination is assigned to the #1 slot only, not to #3 or #5. Among other things, this means that the only two slots in play for all 69 episodes are #1 and #2. Similarly, 63 contestants (not 69) are considered to have "sung third" in an episode – one for each show except for the six Finales. Got all that?
The table at right shows the number of Finals performances per singing slot, and thus the number of possible eliminations. Having laid the groundwork, we're ready to move on to the actual analyses.
Uno, Dos, Tres, Catorce!
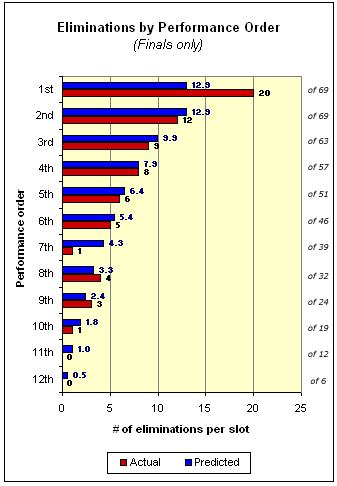
Let's begin with the report featured in USA Today: a straightforward Number Of Eliminations by Performance Order (see chart below). For each of the 12 possible singing slots, we calculated the expected number of contestants to be sent home if eliminations were purely at random. Imagine the Idols walking out on stage during the results show and drawing straws, for example. (The producers would still manage to drag this out to an hour.) The blue bar represents this figure, while the red bar shows the actual number of contestants eliminated from each slot.
 Ten of the twelve slots are within one dismissal of what probability theory predicts. The two that are way off are #1 and #7. In fact, the leadoff slot should have sent home 13 contestants thus far, but it's actually eliminated 20, seven more than predicted. All else being equal, contestants singing first are at a 54% greater risk of elimination than normal.
As for the #7 slot: it should have sent home at least four contestants so far, but in reality just one has met his maker there. Remarkably, that person was AI1's Jim Verraros, in the very first Finals episode that Idol ever aired. Since then, Lucky Seven is on a 38-for-38 safety streak. We're pretty sure this is nothing more than a coincidence, but if you're a future finalist on AI and you're even the least bit superstitious, you know what slot to angle for.
Just one contestant of 37 has gone home singing 10th or later, and that was Leah Labelle in the AI3 Top 12. But perhaps that singular elimination isn't such a surprise. LaBelle's performance of You Keep Me Hangin' On earned an approval rating from Internet reviewers of just 4, tied for the second-lowest ever. That was going to be a difficult one to survive no matter where or when she sang it.
Turn The Beat Around
Now let's take a look at the same data from a different perspective.
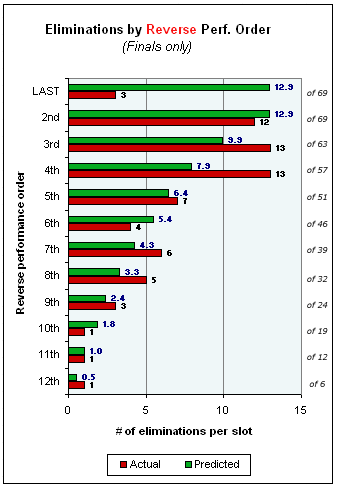
 Instead of ordering the performance slots from the top, we'll count up from the bottom. In this case, "1st" means the contestants who sang last on an episode, "2nd" means second-to-last, and so on. This should give us a better idea of the advantages (or lack thereof) from singing late in an episode rather than early.
The chart at right shows a few interesting trends. First of all, just three finalists have ever been eliminated singing out of the anchor spot, and all came on multiple song weeks: Clay Aiken in the AI2 Finale, Anthony Fedorov in the AI4 Final 4, and Melinda Doolittle in the AI6 Final 3. That's 10 fewer sayonaras than probability theory predicts. No contestant has ever been sent home singing last in a single-song week. (Remember, we're still talking Finals Only; a handful of Semifinalists over the years have bid adieu from the so-called "Pimp Spot.")
The danger spots when counting backwards are third-from-last (10 expected dismissals, 13 actual) and fourth-from-last (8 expected, 13 actual). Things settle down after that. The reverse analysis essentially shows that it's even safer to sing last than it is dangerous to sing first.
If you're wondering, the three contestants sent home singing 10th-, 11th-, and 12th-from-last, respectively, were Lisa Tucker in the AI5 Top 10 (Web approval rating: a 10), Amanda Overmyer in the AI7 Top 11 (a 29), and Brandon Rogers in the AI6 Top 12 (a 12). Note that none performed particularly well and that all three sang leadoff.
The Safety Dance
As you no doubt realize, the assignment of performers to singing slots is probably not done entirely at random. The producers, who are responsible for putting out an entertaining TV show above all, tend to place what they expect will be a popular performance in the anchor spot. In AI2, for example, Aiken and Ruben Studdard sang last nine times combined, including each of the last seven episodes...a fact that did not go over well with the other contestants' fans.
In recent years, the producers have grown a little better at sharing the wealth, so the final performance of the night isn't necessarily the guaranteed winner it once was. Still, they obviously aim not to end the show with a train wreck. Just three anchor performances ever have rated out to the 1-star minimum (19 or below.) One came when David Archuleta repeatedly blanked out on the lyrics to We Can Work It Out earlier this season. The other two: Scott Savol's Dance With My Father, and Josh Gracin's Celebration.
So, we wondered what would happen if we assumed that the final singer was always safe? Would that help to explain why the leadoff spot is so dangerous? After all, if you sing first, you can't possibly sing last, too. The one exception we made was for the season Finale, where the singing order has always been determined by coin flip. That makes it a true random trial.
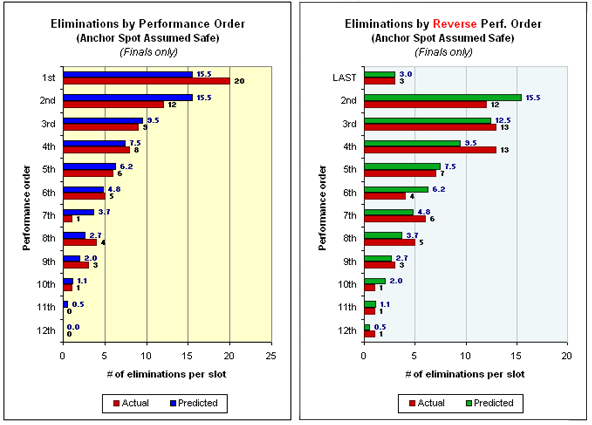
We re-ran our two analyses under these assumptions, and here's what we found:

On the "Forward" (left) chart, the #1 slot is still the most dangerous, but not by quite as much as before. The leadoff singer has about a 30% greater risk of being sent home, rather than the 54% listed above. In either case, the #1 spot is not where you want to be singing if you can help it. The #7 slot is still unnaturally lucky. The #2 spot is reasonably safe, and beyond that it's all pretty close to normal.
On the "Reverse" (right) chart, note that second-from-last is now the safest spot statistically, third-from-last adjusts to right around what we'd expect, and fourth-from-last is still very dangerous.
![]()
![]()
![]()
So what have we learned?
For starters, the "Death Spot" earned that title the old-fashioned way – no matter how you slice it, it's the most perilous place to sing on American Idol. A contestant is somewhere between 30% and 54% more likely to be eliminated when singing first, depending upon how often (and how well) you believe the producers stack excellent performances in the anchor spot.
Would Michael Johns still be in the competition if he'd not sang first that fateful night? Possibly, but keep this in mind: Somebody has to open the show. As Bill Keveney's article shows, the producers seem to be making an effort to spread the risk. Lately their policy has been to have the anchor performer from one episode sing leadoff the next week, so that danger follows safety (as was the case with both of Johns's leadoff assignments.) That might not be a complete solution to the leadoff jinx, but it's not easy to come up with anything substantially better.
More to the point: Every season winner but one so far sang leadoff at least twice and lived to tell about it. Clarkson went first just once (but she appeared in only 9 episodes), while Taylor Hicks did it three times (in 14 episodes.) If a contestant cannot survive a leadoff performance at some point during the Finals, can you really make a case that they were "robbed" of anything?
We re-ran all of these analyses to include Semifinal data as well. Except for a few twists here and there, it shows pretty much the same thing as the Finals-only data. The #1 spot is unsafe at any speed. (The Semifinals analysis is much more complex because of the Wild Card format utilized in the first three seasons. Back then, being "sent home" was sometimes only temporary.)
So if you ever make it to the Finals of American Idol, and the producers graciously give you the option of when you'd like to sing one week, your best answers are:
1) Last
2) Second-to-last
3) Seventh (if you're superstitious)
4) Anywhere but first!
Appendix A: Human Psychology and the Luck Of The Draw
Shortly after this article originally appeared on WhatNotToSing.com, we received a fascinating email from Angela K. Antony, a psychology student at Harvard University. If you think we're the only people warped enough to apply science to American Idol, guess again. Angela has spent three years researching a phenomenon known as "the serial order bias," which affects all sorts of sports and competitions that require subjective judging. Her research addresses the question: does the order in which contestants perform affect how well, or not-so-well, that they're judged?
To study this, Angela set up an experiment using performance clips from Pop Idol, the original British series, because the contestants would likely be unfamiliar to American subjects. She pre-tested the performances to ensure that none were very strong or very weak. (Judging by her description we'd guess the retained clips would rate in the 40 to 70 range on our scale.) Then, she presented 12 clips serially to a large number of subjects and asked them to rank and rate them...but with a twist. Each group of subjects saw the same clips in a different order.
If performance order didn't matter, one would expect that the average rating for each performance slot would be roughly the same. Not even close. The lowest-rated position on average was...care to guess? That's right, #1.
Hold on, there's more. Angela found that average ratings peaked every 3rd or 4th performance no matter what order the clips were presented in. The slot immediately following the peak saw a drastic drop-off, usually back to the baseline set by the leadoff singer. This cycle repeated through the first nine singers. (Slots #10, #11, and #12 followed a different pattern owing to a competing "recency effect", which she explains in her summary much better than we ever could.)
Angela and the Harvard Psychology Department have graciously given us permission to offer her summary "poster" results for download. You'll find it in the WNTS.com Library under "Luck Of The Draw."
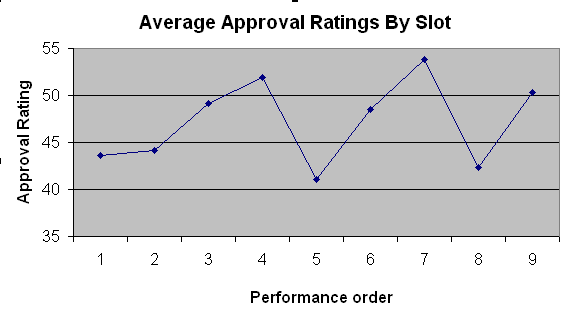
At any rate, we wondered whether the approval ratings in our database would follow the pattern Angela discovered. To duplicate her setup as best we could, we considered only episodes in which there were 10 or more performances. Then, we threw out slot #10 (because, in a show with exactly 10 slots, the producers would often try to close the show with a performance they expected to be good, and that would skew the numbers.) Forty-two American Idol shows fit the description. Would we get the same "sawtooth" pattern with peaks every third or fourth slot followed by big drop-offs, as Angela predicted? We ran the data through our spreadsheet....
...well, whaddya know?:

- The WNTS.com Team

